r3 - 28 Sep 2008 - 23:22:48 GMT - VladAtanasiuYou are here: Bernstein > Main Web > WebStatistics > WebStatisticsAnalysis
Lessons for Collaborative Projects
What website usage statistics might reveal. A case study.
This document analyzes the usage statistics for the websites of the Bernstein project for the period May 2006 - August 2008. Bernstein is a scientific project in the area of digital cultural heritage, specifically paper and watermarks studies. It involves nine partners from six European countries and is co-funded by the European Commission. It is hoped that the lessons derived from this project can be helpful for the coordination of other collaborative projects.Collaboration instruments
Instruments set up at project level:- Project website - the showcase for the activities of the project directed towards the public
- Development website - the common blackboard and document repository of the project partners
- Emailing list - servers as communication instrument
- Telephone
- Meetings
Data analyzed
Collaboration patterns were analyzed for the project-level instruments, for which quantitative data is available. Access the raw data and the data processed for evaluation.Limitations
- This analysis is based on only the project-level communication instruments, for which data is available to the author.
- An assumption made in the following analysis is that for a project in non-extreme conditions the intensity of exchanges between partners is indicative of the healthiness of the debate and collaboration efforts.
Data reliability
Statistics are notoriously prone to easy misinterpretations, especially website or browser usage statistics. The analysis software might not record all the traffic, misinterpret it or be mislead disguised requests. The resulting data has to be carefully considered by the analyst, not taken at face value. An example from this project shows that a considerable percentage of the requests on the website are due to automated page scans of Web search engines. In November 2006 for example, Google and other robots accessed the TWiki continuously every 1 to 2 minutes for more than 24 hours in a row. Thus the numbers of “hits” are not an accurate record of how many times humans accessed the website. To ensure data reliability for this analysis several methods have been applied.- Inherent limitation - The main problem is limited to the project website statistics, which collects a plethora of information about the traffic, such as type of browser and operating system of the users, the country of the requested server, etc. . The development website and the email list however provide accurate data, of the type “files uploaded” or “messages posted”.
- Discarding requests - Since the actual number of requests is misleading, only the relative trend, percentages in increase and decrease, was retained for analysis. It is assumed that the underlying bias sources such as search robots activity remains constant.
- Selecting data types - Only data types that are not problematic were considered. For example the number of pages saved to the development site is a better measure of the activity than the “views”.
- User continuity - While some users might have left early the project with an impact on the statistics, the majority were present throughout the analyzed period.
- The first user has saved the page more often than the second for the same amount of text;
- s/he has modified a sentence while the other has added a paragraph;
- s/he added content to a page initiated and structured by the second user.
Analysis
Server load
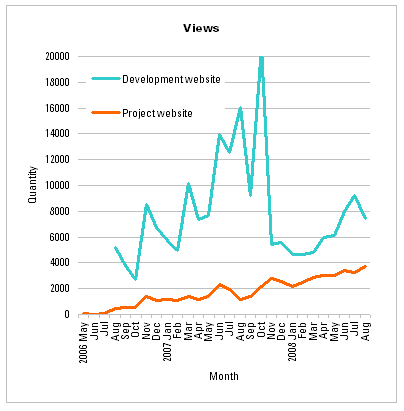
 The diagram shows the number per month of requests made to the Bernstein server for project and development websites pages.
Main features:
The diagram shows the number per month of requests made to the Bernstein server for project and development websites pages.
Main features: - Increase in requests.
- Downward trend after annual meetings (July of each year) and during holidays.
- + The project becomes known by an increasing number of individuals.
Search words
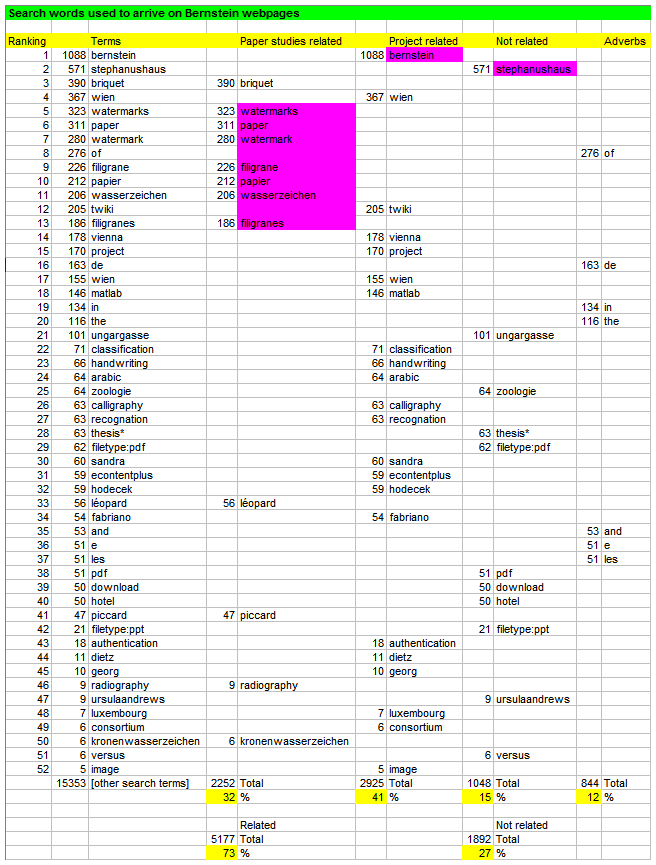 This lists shows search words by which users arrived to the project webpage.
Main features:
This lists shows search words by which users arrived to the project webpage.
Main features: - Most frequently (73%) users arrive by conducting general searches in the area of paper studies (with words such as “watermarks” and “papers”).
- Many users look for information about project Bernstein, of which they already heard about (this is the most frequent search word).
- Some users arrive because of information not related to the topic of the website, paper studies, that is however present in the website, such as hotel addresses (search word “stephanushaus”).
- Among the elements of the Bernstein workspace, the most in demand appears to be the integrated catalog (no search word on the historical Atlas, the bibliography or the dissemination kit).
- + Increased knowledge about the project’s existence.
Page updates
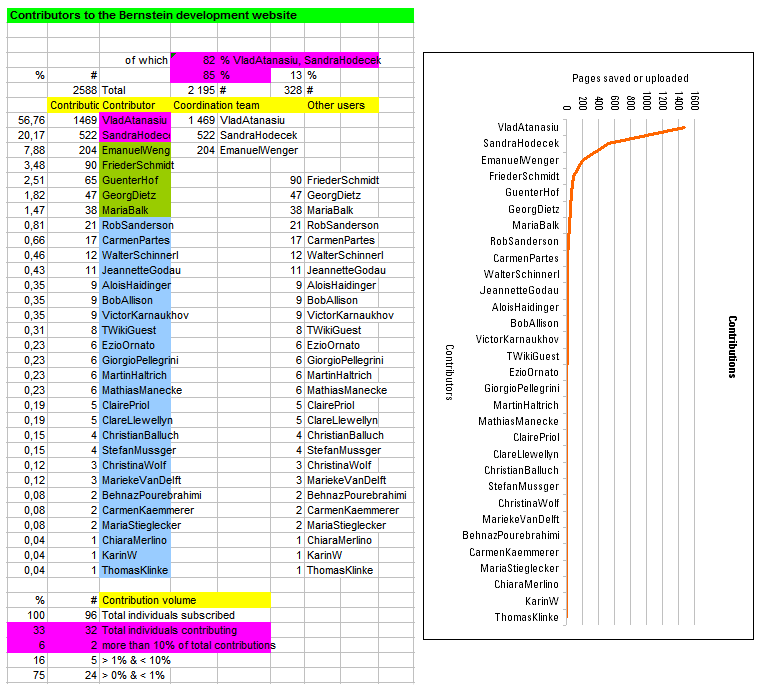
 This lists the various pages on the development website that were created and subsequently modified.
Main features:
This lists the various pages on the development website that were created and subsequently modified.
Main features: - Those pages are more often (87%) modified that have content intended for one-way communication of information, not many-way debates (meetings and exhibitions, 13%). One-fourth thereof is directly involving the participants (venues information, user contacts, photos from meetings).
- Pages that are regularly updated are also those that have the potential to impact the widest number of users (the documents archive, the paper databases repertory, the exhibition and the dissemination products). These pages are also some of the best organized within the website and each the individual work of dedicated participants.
- Pages of the work-packages, intended for the development of outputs, are far less frequently updated (DataHarmonization, MultilingualSupport, etc.).
- + The concept of a website as a document repository for managing the project has proven to be successful.
- + The most popular pages are those with content interesting to a wide audience.
- + Dedication and organization are key to success.
- - The concept of a website as common blackboard and debate platform for the project participants is a failure.
Contributors
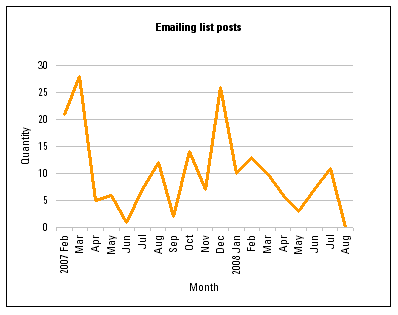
 List of users of the development site, number and month of contributions; diagrams.
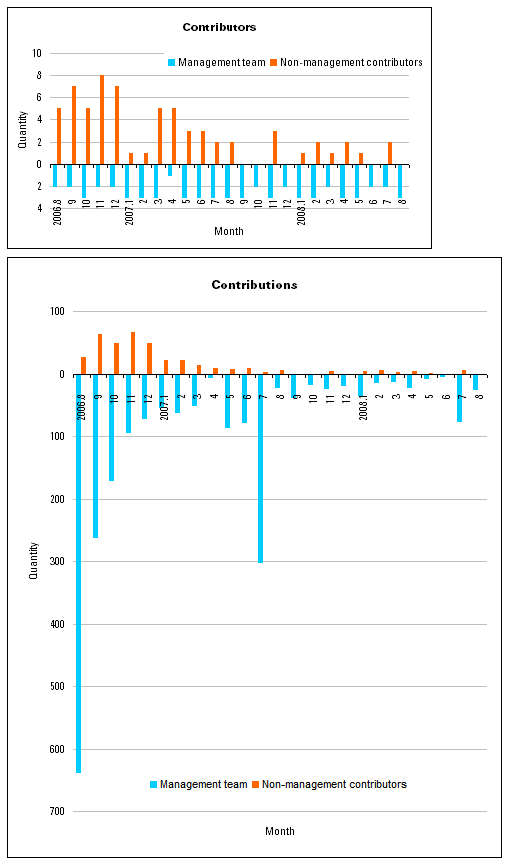
 Frequency: number of contributors (top) and contributions(bottom) per month.
Main features:
Frequency: number of contributors (top) and contributions(bottom) per month.
Main features: - Two-thirds of the subscribed users never contributed; the overwhelming majority of contributions (94%) are due to only one-quarter of the active contributors, of which the majority (82%) is due to only two individuals; the vast majority of contributions (85%) are due to the project coordination team.
- The volume of contributions and number of contributors is decreasing, the majority having taken place in the first half of the project (92% of contributions due to contributors other than those belonging to the coordinator team; and 74% of the cumulative number of individual contributors for each half period).
- Activity spikes are recorded at the onset of the project and prior to annual meetings.
- + Active coordination team.
- - Low participation levels to the development website.
Emailing list
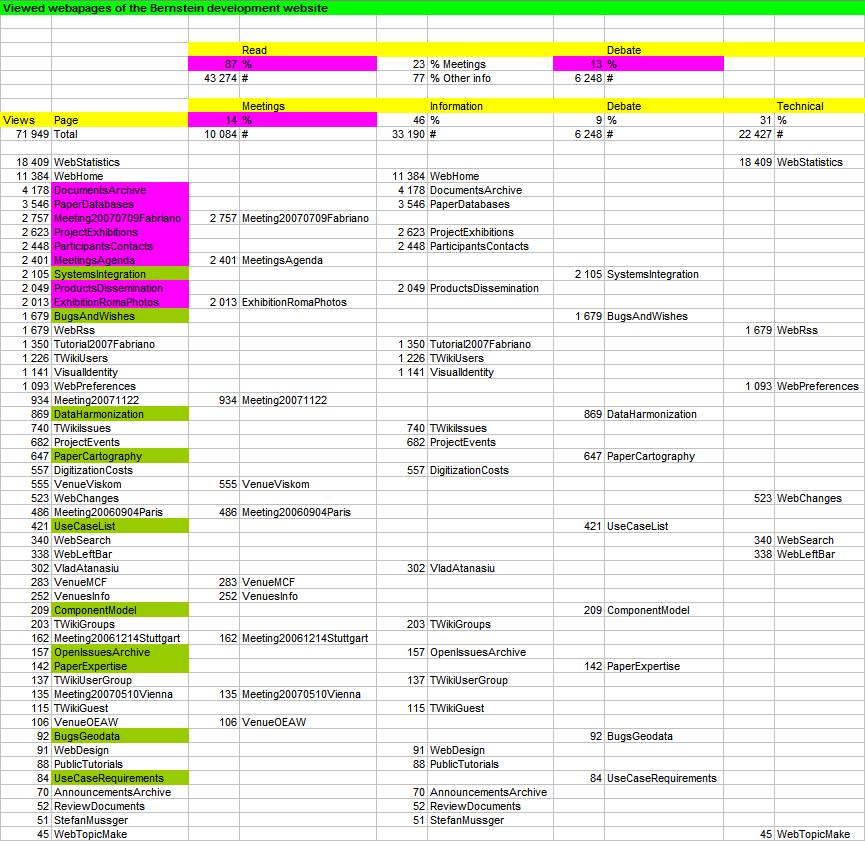
 Usage list and diagram showing the number and types of posts on the project’s emailing list.
Main features:
Usage list and diagram showing the number and types of posts on the project’s emailing list.
Main features: - The primary use of the emailing list is for information, rather than debate (77%, respectively 23% of posts).
- + The emailing list adds to the communication instruments of the project, covering a specific type of communication, that of easy generated messages addressed to the entire community.
- - The emailing list didn’t evolve into a media for debate.
Conclusions
- + The project website appears to increase the number of people knowing about the project.
- + The use of the development site and the emailing list as document storage and information media is successful.
- - Collaboration through the media set up at project level is low for this user group and gets lower.
Lessons
- Collaboration is difficult to harness, however critical to the project performance.
- Adequacy of communication instruments to the targeted community and their diversification facilitates collaboration.
- Well organized webpages and documented electronic resources are important factors for their popularity.
-- VladAtanasiu - 17 Sep 2008
| I | Attachment | Action | Size | Date | Who | Comment |
|---|---|---|---|---|---|---|
| | statistics_contributors.png | manage | 42.3 K | 17 Sep 2008 - 22:40 | VladAtanasiu | |
| | statistics_emailinglist.png | manage | 4.8 K | 17 Sep 2008 - 22:40 | VladAtanasiu | |
| | statistics_pages.png | manage | 38.4 K | 17 Sep 2008 - 22:41 | VladAtanasiu | |
| | statistics_searchwords.png | manage | 28.6 K | 17 Sep 2008 - 22:41 | VladAtanasiu | |
| | statistics_views.png | manage | 6.6 K | 17 Sep 2008 - 22:41 | VladAtanasiu | |
| | bernstein_web_statistics.xls | manage | 131.5 K | 17 Sep 2008 - 22:42 | VladAtanasiu | |
| | statistics_frequency.png | manage | 12.3 K | 17 Sep 2008 - 22:54 | VladAtanasiu |
COMMONS
WORKPACKAGES
* TOOLS SITE INFO |
|
|
| Copyright © by the contributing authors. Bernstein - The Memory of Paper http://www.bernstein.oeaw.ac.at Ideas, requests, problems regarding Bernstein? Send feedback | |